Not just where you rank.
How you got there.
Every daily check is kept, so each keyword and project builds a history you can read: what moved this week, which pages carry the rankings, and whether a dip lines up with a Google update.
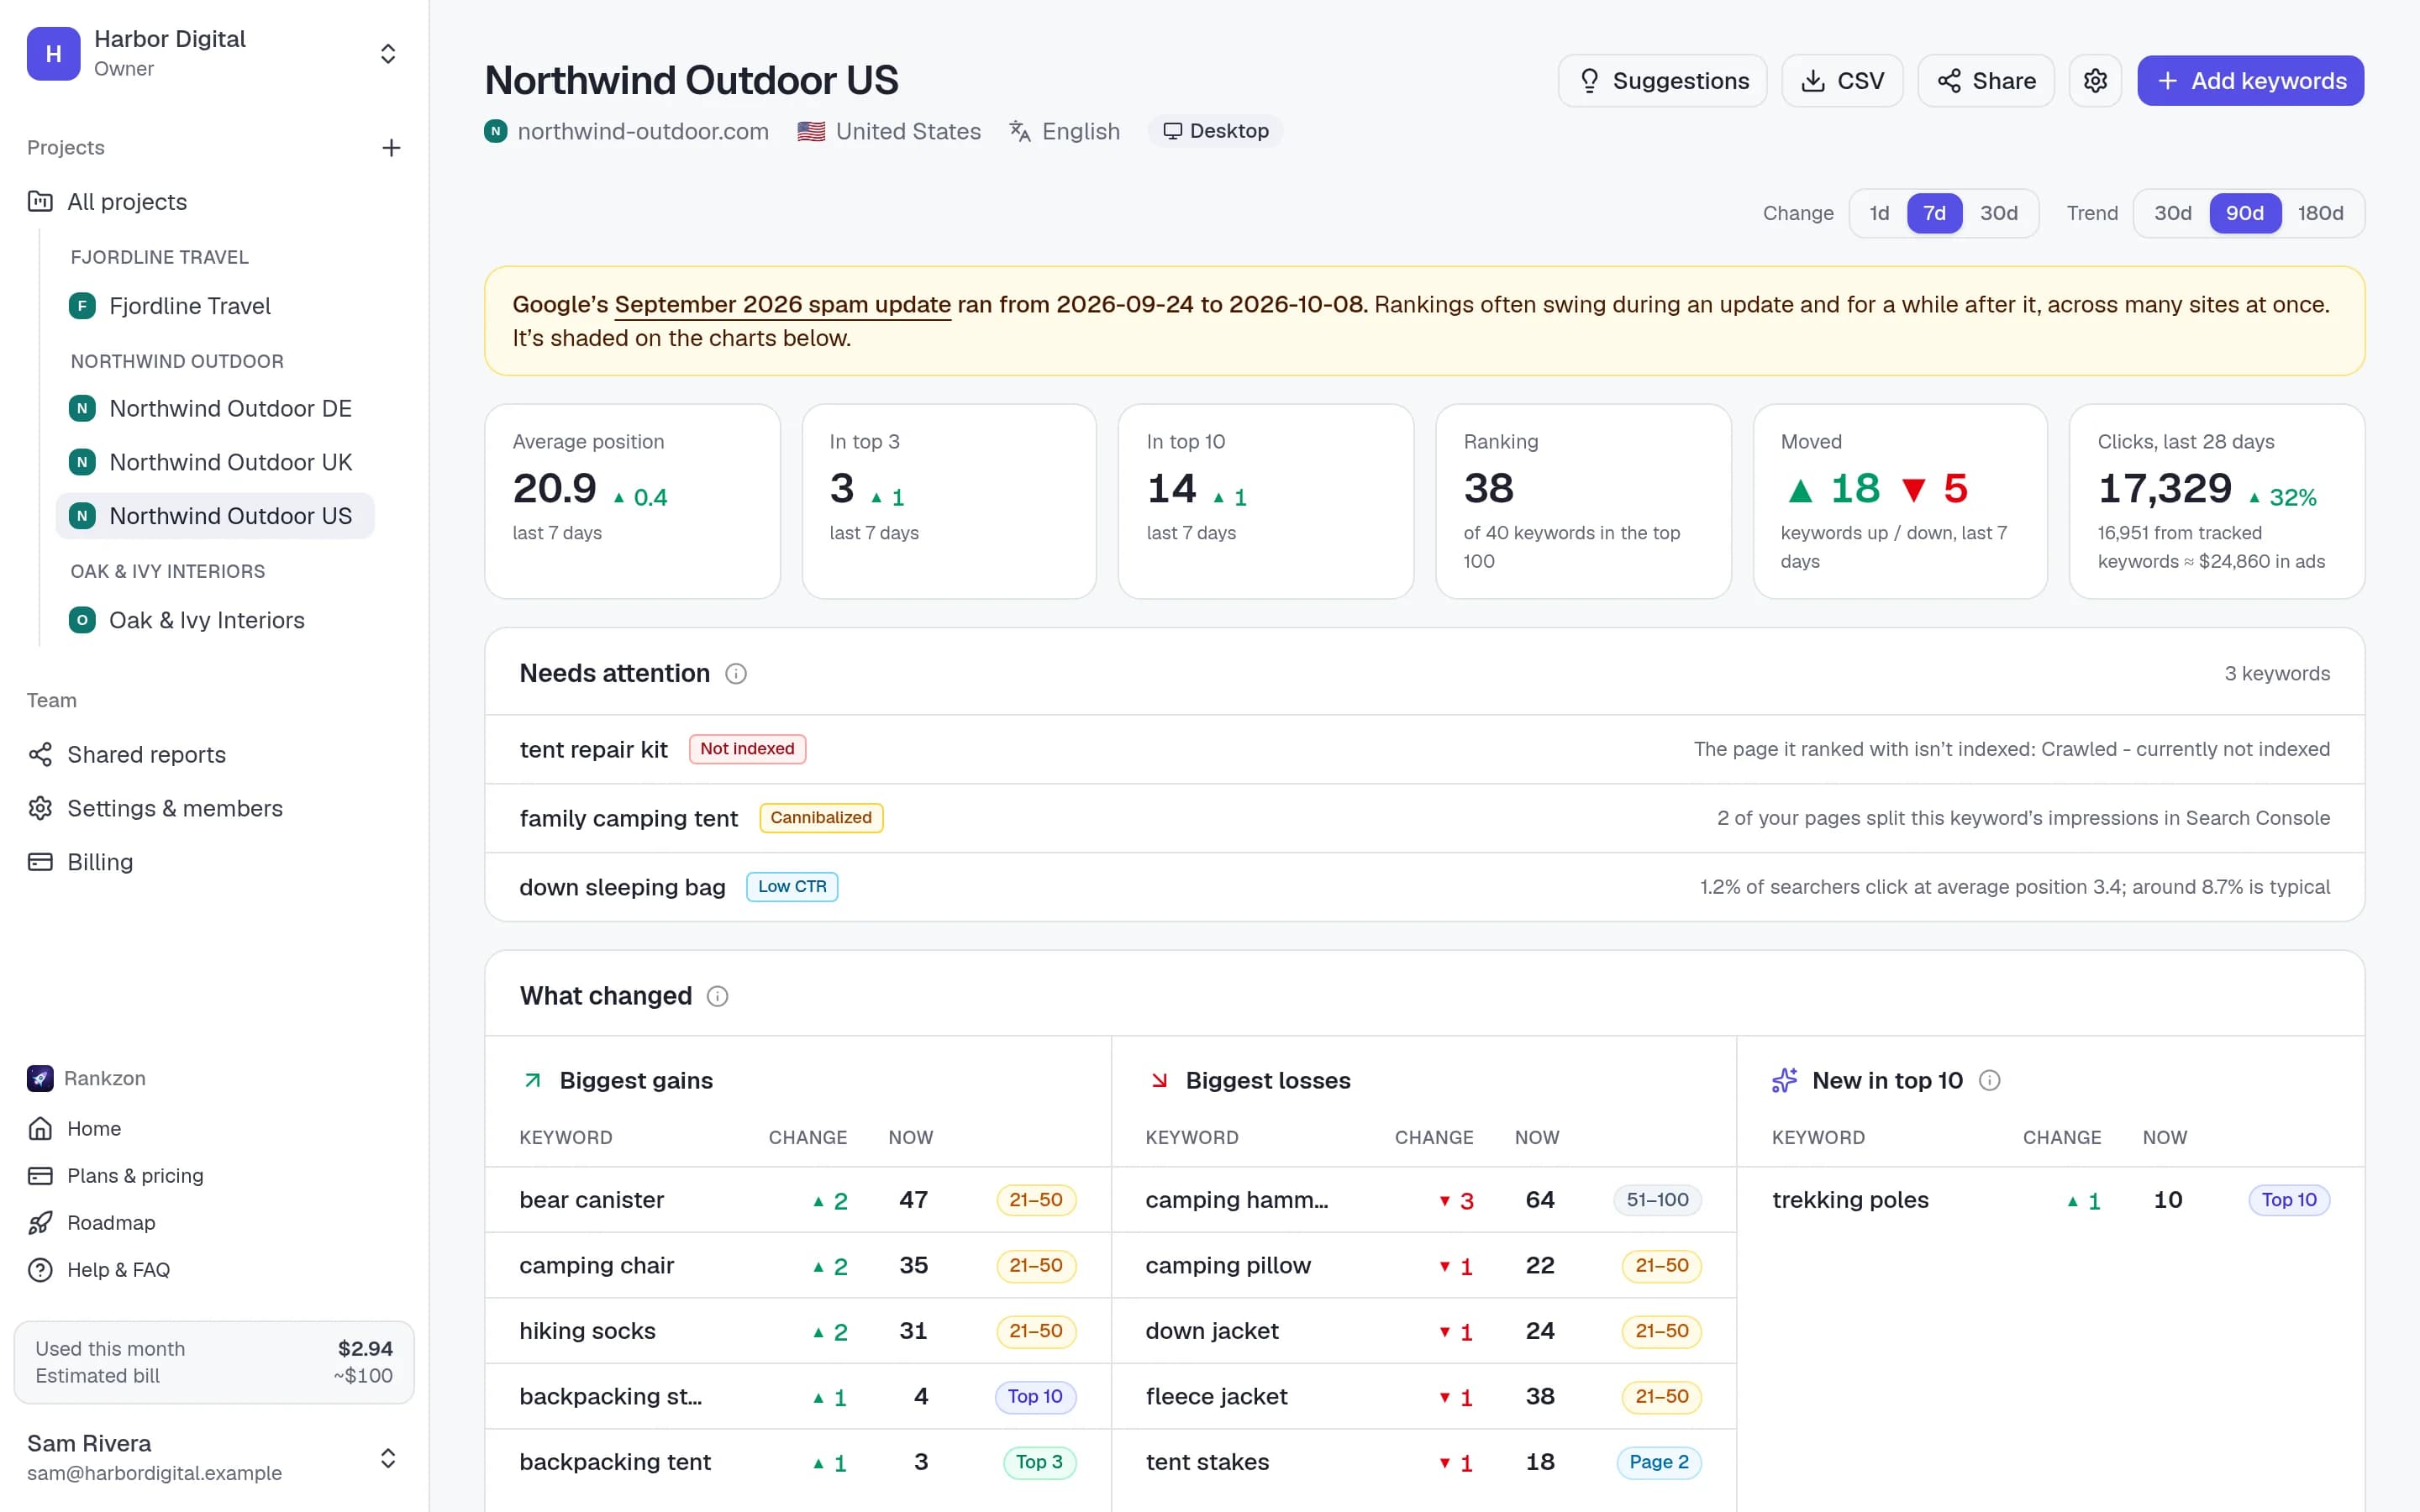
The project overview
The story of a project, before the Monday stand-up
Pick a change window of 1, 7 or 30 days and a trend period of 30, 90 or 180 days, and the overview answers the questions a client asks.
What changed
The biggest gains, the biggest losses and the keywords that just entered the top 10, for the window you picked.
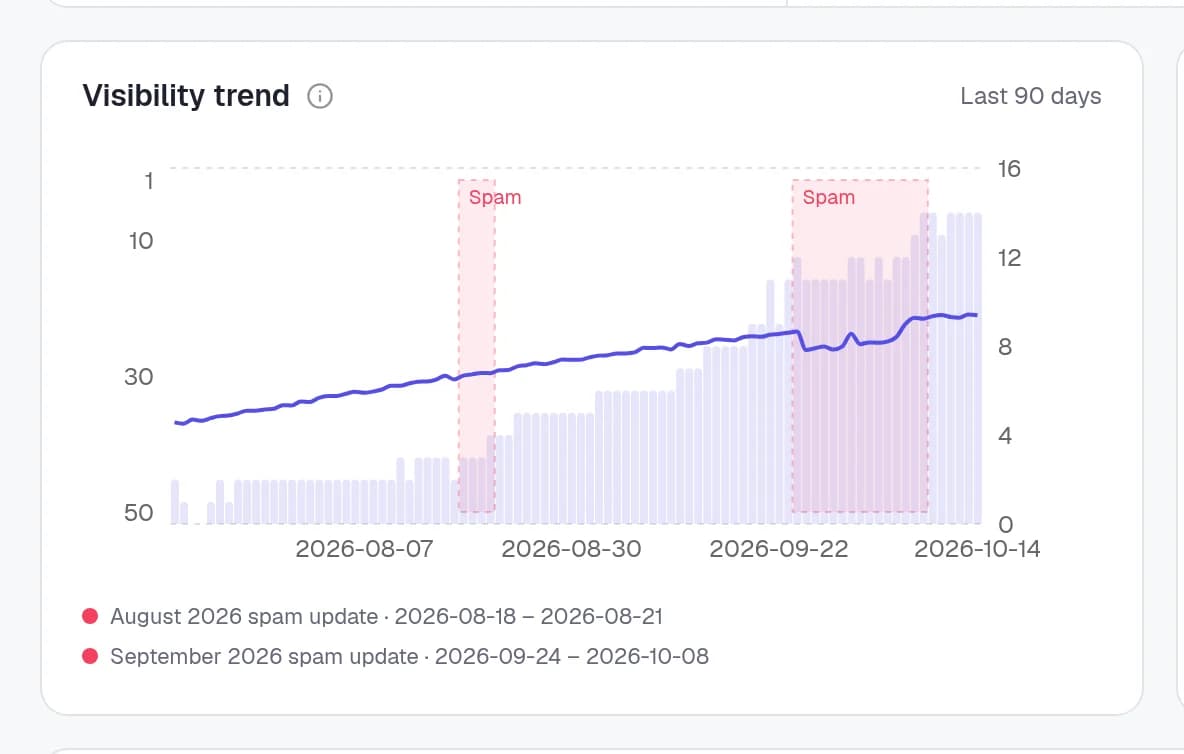
Visibility trend
Average position and the number of top-10 keywords over time, so a slow climb is visible even when no single keyword jumps.
Position distribution
How many keywords sit in the top 3, top 10, page 2, positions 21–50, 51–100 and outside the top 100.
Top pages
The pages that rank, with how many keywords each one carries, its best and average position and their combined volume.
Summary cards
Keywords tracked, average position, top 3, top 10 and how many moved up or down, each with its change.
CSV export
Download any project’s keyword table with positions, changes, best position, ranking URL and metrics.
Google updates on every chart
When a whole project dips, check the calendar first
Google’s announced core, spam and reviews updates are shaded on every ranking and traffic chart, in the app and in client reports. The rollout dates come from Google’s own Search Status Dashboard and are refreshed through the day.
So when ten keywords drop in the same week, you can see straight away that it was an update rolling out, not something you changed, and show the client the same chart.
One keyword, in depth
Up to a year of daily positions per keyword
Open any keyword for its position chart over up to 365 days, a day-by-day log with each change, its best position and the page that ranked. With Search Console linked, Google’s own average position is drawn as a second line.
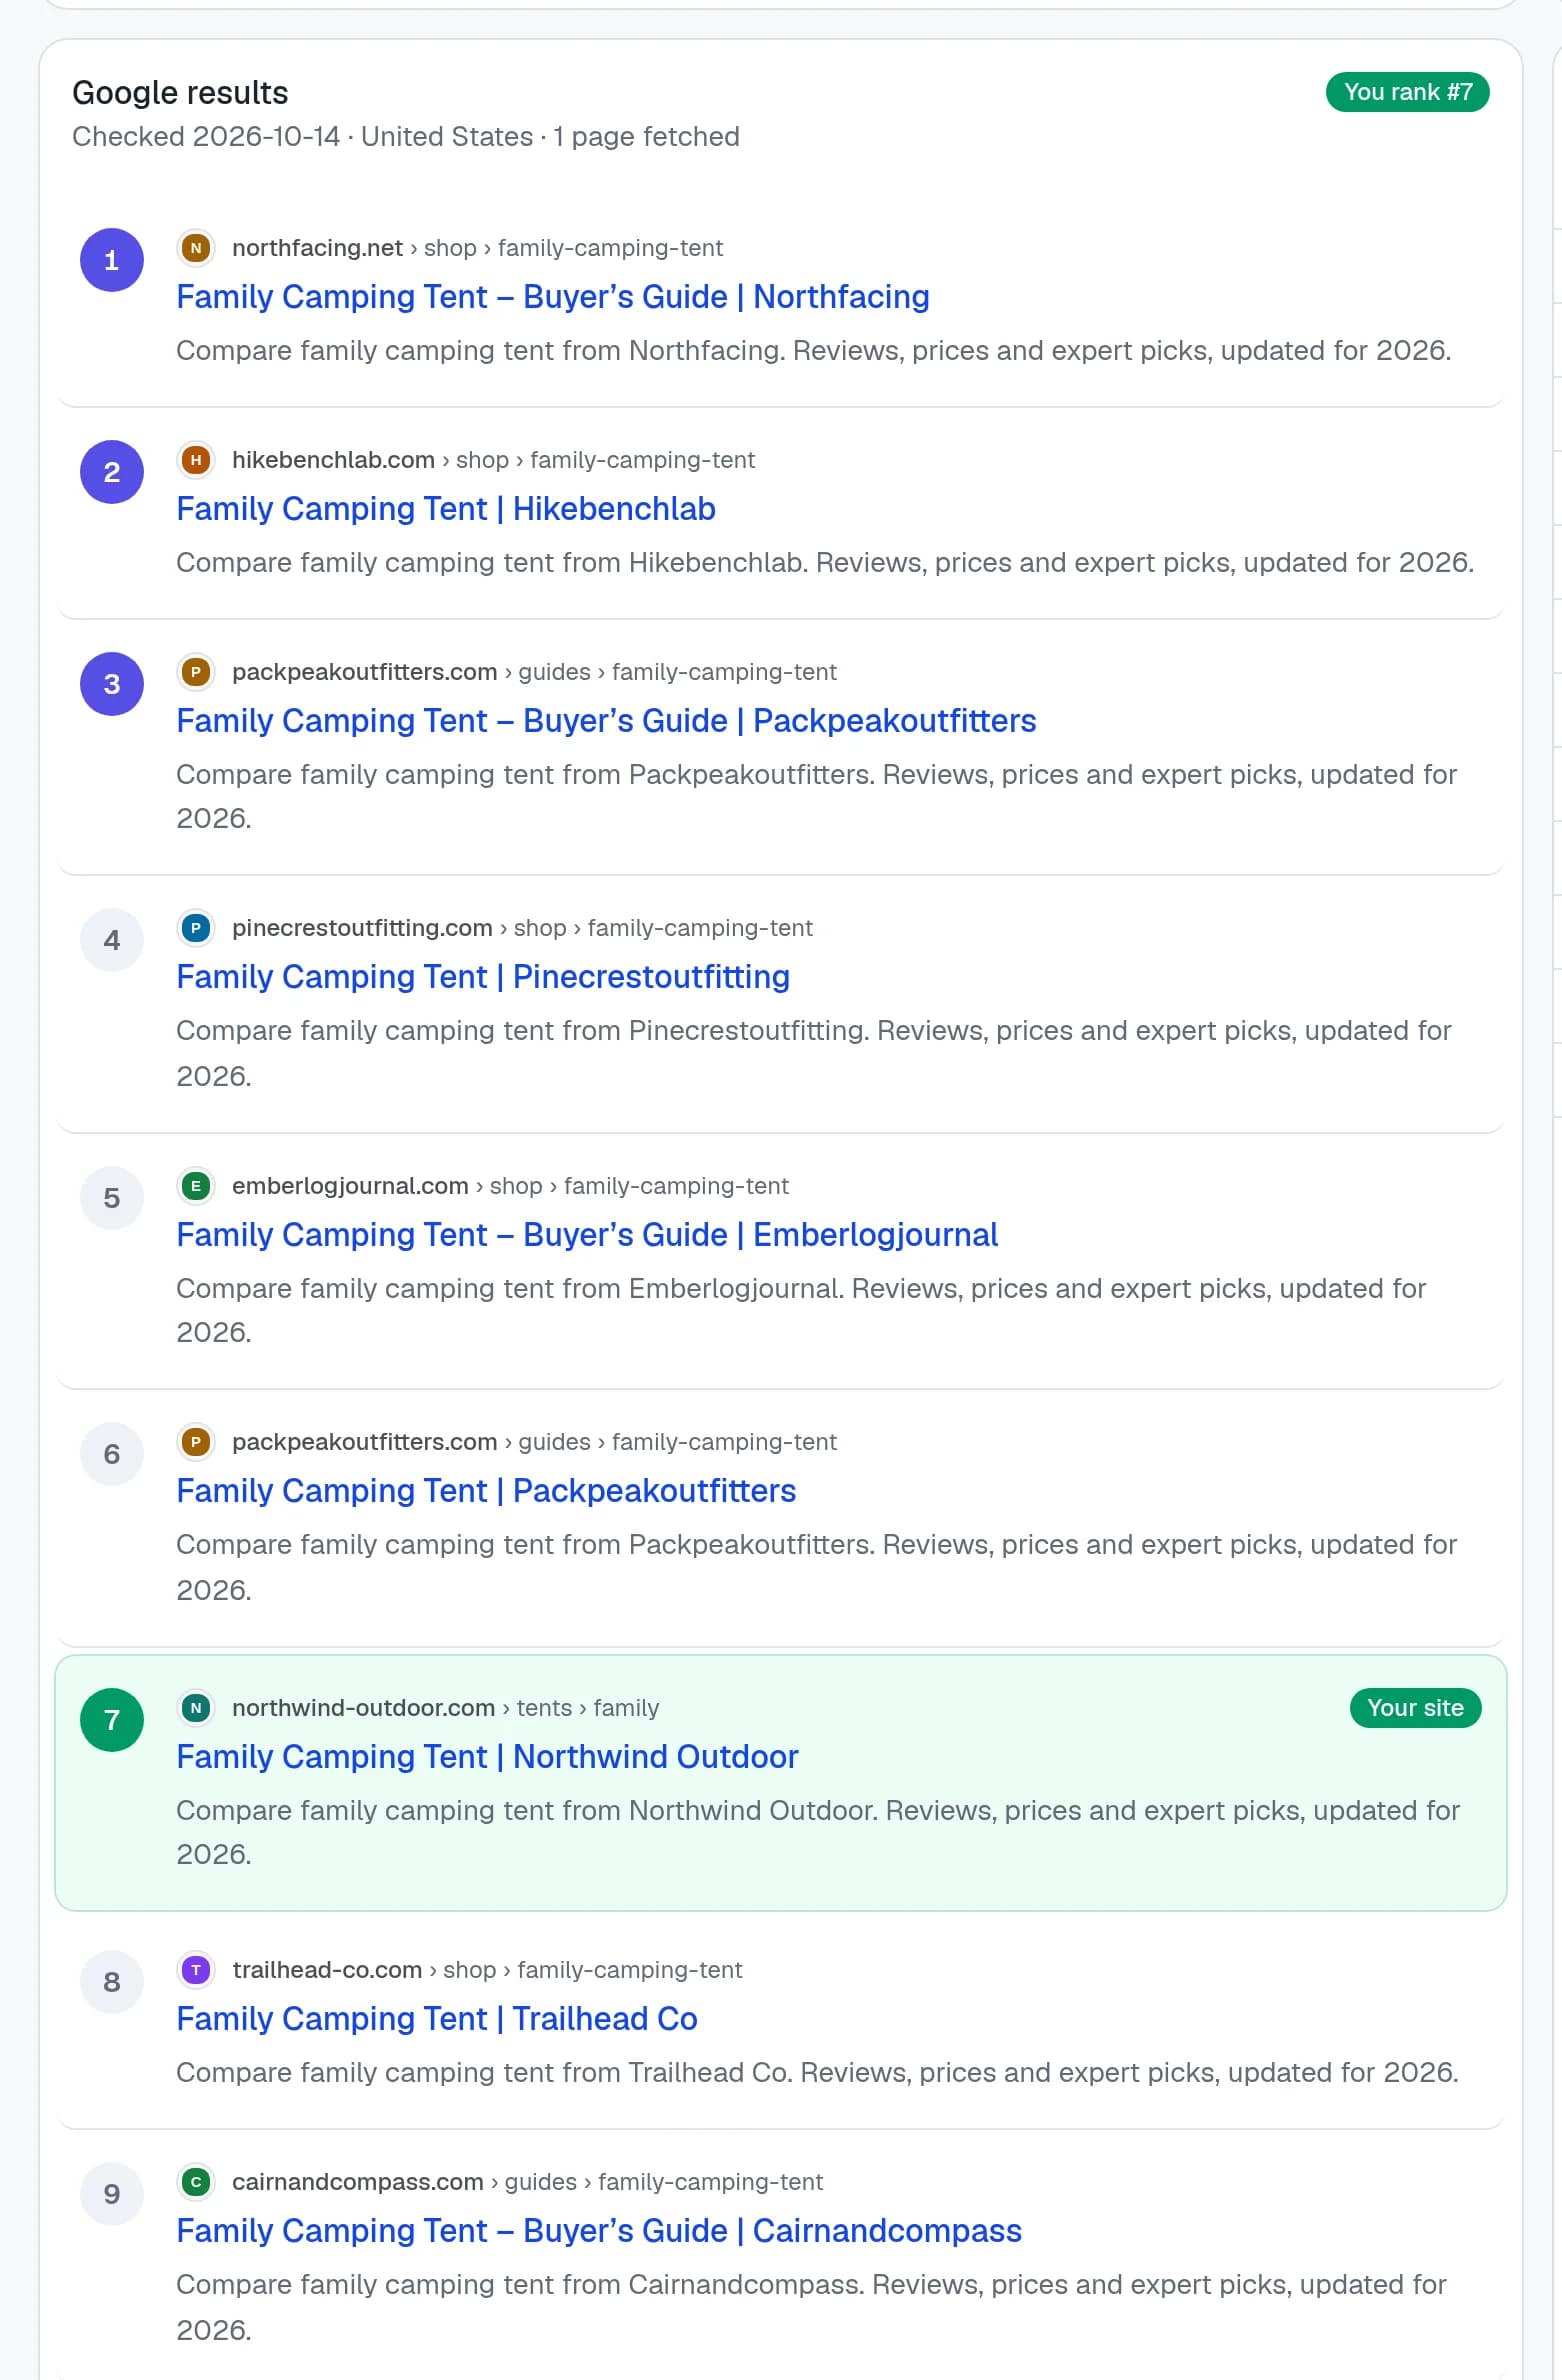
Below it are the Google results from the latest check, with your result highlighted, so you can see exactly who is above you today.
Ranking history, answered
Questions, answered
How far back does ranking history go?+
From the day you start tracking a keyword, kept for as long as you track it. Charts show up to 365 days at a time.
Can I see rankings from before I started tracking?+
Not our own daily positions, since we only have the days we checked. But if you link Google Search Console, its average position and clicks go back up to 16 months from the first day.
Which Google updates are shown?+
The ranking updates Google announces on its Search Status Dashboard, such as core, spam and reviews updates, shaded across the days they rolled out.
Can my clients see this history?+
Yes. A shared report shows the summary, what changed, top pages, distribution, visibility trend and keyword table in your brand, and can link through to each keyword’s history.
Can I export the data?+
Yes, every project’s keyword table downloads as CSV, including positions, changes, best position, URL and keyword metrics.
Your rankings, with context.
From the first day.
Start tracking and the history builds up daily. Link Search Console and you get 16 months of Google’s data on day one.